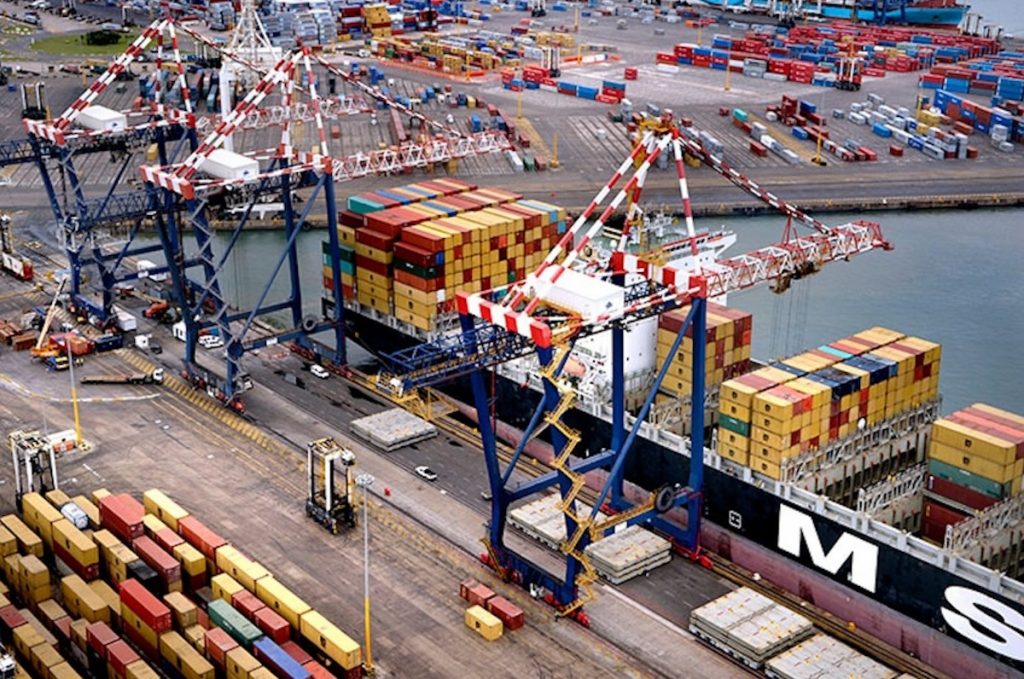
Despite U.S. decline, global container traffic sets new record

Global container volumes continued strong in 2025 with record August traffic despite weaker results from North America.
August volume was 16.61 million twenty foot equivalent units, according to Container Trade Statistics, and the highest monthly volume ever, surpassing 16.59 million TEUs in May 2025.
The record came despite an 0.5% decline in North American imports, including the United States, as a weaker August moderated a recovery that showed volumes up 1% in July year-to-date.
For the first eight months of 2025, global container volumes were 126.75 million TEUs, 4.4% better than the same period in 2024.
“While the month-on-month increase was modest at 0.2%, it highlights the consistently high level of global volumes in 2025,” CTS said in a release. “In fact, August marks the fourth consecutive month in which global volumes have exceeded 16 million TEUs.”
The gains come as the Trump administration’s tariff policy disrupts benchmark China-U.S. trade on the trans-Pacific. Washington and Beijing in early August for a second time paused retaliatory tariffs for 90 days in an effort to reach a trade agreement, but the damage was done as U.S. importers spent the early summer frontloading goods, depressing August volumes. But any ripple effects have so far failed to dent growth through the global supply chain.
The CTS data showed regional imports well ahead year-to-date across all regions except North America. Sub-Saharan Africa, the Indian sub-continent and Middle East, and South and Central America, were up 16.4%, 8.7%, and 7.5%, respectively. Europe followed with a 7.3% increase, which was bolstered by imports from the Far East and the Indian sub-continent and Middle East, both up 8.5% y-t-d.
All regions posted export increases except North America, which saw a 2.7% decline. Six of the seven regions recorded year-to-date growth, but gains were less pronounced than imports, CTS said.
The Far East and Indian sub-continent and Middle East saw the largest year-to-date export increases, up 6.4% and 5.9%, as China found fresh markets for its goods and manufacturing shifted to other Asian nations. Europe’s exports remained flat, up just 0.1% y-t-d, after a 6% month-on-month decline in August.
Global Price Index softens
The CTS Global Price Index, which measures global container shipping freight rates based on invoiced data collected from major shipping lines, fell by 3 points in August, to 81 points, continuing a steady decline since June. The index was at 115 points at the same time a year ago, “reflecting ongoing market adjustments despite strong volume performance.”
Do you want to build your own blog website similar to this one? Contact us


